The Spatial Entropy of Typing: Measuring the Jumps on Your Keyboard

Every day, we type thousands of words. Our fingers move from letter to letter without much conscious thought. A large-scale study by Aalto University and ETH Zürich analyzed 136 million keystrokes from over 168,000 people across the world. The data shows that the average person types about 52 words per minute. For a typical office worker, this adds up to somewhere between 40,000 and 60,000 individual keystrokes every single day.
If we look down at our hands, one might notice that the standard QWERTY layout requires a lot of physical movement. The most common letters in the English language are scattered across different rows. Your fingers must stretch and jump just to complete a simple sentence. There is a historical reason for this design. When Christopher Latham Sholes developed the early commercial typewriter in the 1870s, his original models used an alphabetical layout. Early users ran into a major mechanical issue. When they typed common letter combinations quickly, the metal typebars that struck the paper would collide and jam.
To solve this problem, the creators adjusted the layout over several years. They positioned common consecutive letter pairs, such as “TH” and “ER”, far apart from each other. This physical separation ensured that sequentially struck keys came from opposite sides of the mechanism. The separation successfully reduced mechanical clashing. Today, our computers do not have mechanical levers that jam. We still use this exact layout anyway. Every word you type requires a specific sequence of physical movements, dictated by historical engineering constraints.
This brings up a unique question. If the keyboard layout enforces a specific physical distance between letters, we can use mathematics to measure the structure of a word based on how much your hands move.
This concept connects a physical interface directly to information theory. In mathematics, information is a measure of surprise. If an event is highly predictable, it holds very little information. If an event is unexpected, it holds a high amount of information. By treating the physical jumps on a keyboard as a proxy for probability, we can calculate the literal entropy of the words we type. We can find out which words keep your fingers resting quietly in a single corner, and which words force your hands to move across the entire board.
The Mathematical Foundations of Information
In 1948, a mathematician and engineer named Claude Shannon published a paper titled “A Mathematical Theory of Communication.” This work founded the field of information theory. Before Shannon, people viewed communication mostly through the physical lens of radio waves, electrical voltages, or acoustic signals. Shannon reframed the entire concept using mathematics and probability.
In everyday conversation, we use the word “information” to mean meaning, facts, or knowledge. In information theory, information has a precise mathematical definition based on probability and surprise.
If an event is completely certain to happen, telling someone about it gives them no new information. For instance, stating that the sun will rise tomorrow carries zero information because there is no surprise. Information is the literal measure of how much uncertainty is reduced when an event occurs.
To measure this surprise mathematically, Shannon defined the information content $I(x)$ of a single event $x$ with the following formula:
\[I(x) = -\log_2 P(x)\]In this equation, $P(x)$ represents the probability of that specific event occurring. The negative logarithm ensures that as the probability of an event decreases, its informational value increases. Rare events carry high information because they surprise us, while common events carry low information.
The logarithm uses a base of 2 because it measures information in binary choices, which we call bits. One bit represents the amount of information gained from a single choice between two equally likely outcomes, like a fair coin flip.
What is Entropy?
While the information formula measures the surprise of a single isolated event, a message or a system is usually made up of many different events. To measure the average uncertainty of an entire system, Shannon introduced the concept of Information Entropy. He named it after a similar concept in thermodynamics that measures disorder.
The formula for the Shannon entropy $H$ of a system is the weighted average of the information content across all possible outcomes:
\[H(X) = -\sum_{i=1}^{n} P(x_i) \log_2 P(x_i)\]This equation sums up the probability of each outcome multiplied by its individual information content.
If a system is perfectly predictable, its entropy is zero. For example, a two-headed coin has an entropy of zero because the outcome is always certain. There is no surprise. If all possible outcomes are equally likely, the system reaches its maximum possible entropy because the total uncertainty is at its highest point.
With this mathematical foundation established, we can now step away from abstract coins or radio signals and apply these exact formulas to the physical layout of the keyboard underneath your fingers.
Mapping the Board: Keys as Coordinates
To calculate the physical distance between letters, we must turn the keyboard into a mathematical map. We can do this by placing the layout on a two-dimensional grid with horizontal $X$ and vertical $Y$ coordinates.
The three rows of letters represent our vertical points:
- Top Row (Q to P): $Y = 0$
- Middle Row (A to L): $Y = 1$
- Bottom Row (Z to M): $Y = 2$
Because keys on a standard keyboard are staggered rather than perfectly aligned, we use fractional numbers for the horizontal positions. The key Q starts at the far left at $(0, 0)$. The key A sits slightly to the right, so its position is $(0.5, 1)$. The key Z shifts even further, resting at $(1.25, 2)$.
Once every letter has a specific coordinate, we can measure the straight-line distance ($d$) between any two keys using the standard Euclidean distance formula:
\[d = \sqrt{(x_2 - x_1)^2 + (y_2 - y_1)^2}\]For example, moving your finger from A $(0.5, 1)$ to S $(1.5, 1)$ covers a distance of exactly $1$. Moving from A $(0.5, 1)$ to P $(9, 0)$ requires a much larger physical jump.
Connecting Distance to Shannon Entropy
Now we can bridge the gap between physical distance and information theory. As established by Claude Shannon, entropy measures the average amount of uncertainty or surprise in a sequence of events.
To apply the entropy formula to our keyboard, we introduce the Lazy Typist Model. This model assumes that a typist naturally prefers to minimize physical effort. Because people want to save energy, short finger movements are highly likely, while long jumps across the board are rare.
This means the probability of moving to a next letter is inversely related to its distance from the current letter.
- Short distance means a high probability of occurrence.
- Long distance means a low probability of occurrence.
In the script, this connection happens in three steps. First, we calculate the physical distance from one key to every other key. Then we convert each distance into a weight using:
\[w = \frac{1}{1 + d}\]The $1 + d$ term prevents division by zero when a letter repeats, and it makes nearby keys receive larger weights than faraway keys. But this weight is not yet a probability. To turn it into one, we divide the weight of a specific jump by the sum of all possible jump weights from the same starting key:
\[P(\text{next key} \mid \text{current key}) = \frac{w_{\text{current} \rightarrow \text{next}}}{\sum_{\text{all keys}} w_{\text{current} \rightarrow \text{key}}}\]So the probability here is not taken from a real typing dataset. It is a model probability created from the keyboard geometry. From any current key, we ask: “If a lazy typist prefers nearby keys, how likely is each possible next key compared to every other option?” Nearby keys get a larger share of the probability mass. Faraway keys get a smaller share.
Take the word CAT as a small example. It has two transitions: C → A and A → T.
For C → A, the physical distance is about $2.93$ units. The distance weight is:
\[w_{C \rightarrow A} = \frac{1}{1 + 2.93} \approx 0.255\]But from C, there are 26 possible next letters. When we calculate the weights from C to every letter and add them together, the total is about $8.28$. So the normalized probability of jumping from C to A is:
\[P(A \mid C) = \frac{0.255}{8.28} \approx 0.0307\]Now we apply Shannon’s information formula:
\[I(x) = -\log_2 P(x)\]That gives the C → A transition an entropy value of:
\[-\log_2(0.0307) \approx 5.02 \text{ bits}\]The second transition, A → T, has a similar model probability of about $0.0309$, which gives about $5.02$ bits again. The word CAT therefore has an average spatial entropy of roughly:
\[H_{\text{CAT}} = \frac{5.02 + 5.02}{2} \approx 5.02 \text{ bits}\]A word’s final score is just the average of these transition-level entropy values across every adjacent letter pair.
In information theory, highly predictable events carry very little surprise. If you type the word “AS”, the distance is short, the probability is high, and the resulting entropy is low. If you type the word “AP”, the distance is large, the probability is low, and the unexpected jump creates high entropy.
Normalizing the Data for Word Length
If we only look at the total combined entropy of a word, longer words will always win. A ten-letter word naturally accumulates more total finger movement than a five-letter word just because it contains more letters.
To create a fair system, we must calculate the average entropy per transition. A word with $N$ letters will always have $N - 1$ transitions between those letters. We divide the total structural entropy by the number of transitions to get the normalized score:
\[H_{\text{avg}} = \frac{H}{N - 1}\]This metric gives us an efficiency rating. It allows us to compare a short word like “ZALOP” directly against a long word like “CHARACTERISTIC” to see which one forces the hand into the most explosive patterns relative to its length.
Experimental Design
To test these ideas on a large scale, I used a public dataset called words_alpha.txt from GitHub. This file contains 370,105 valid English words. Processing hundreds of thousands of words can slow down a computer if you calculate the distance formula for every single letter transition over and over. To solve this, the script uses a $26 \times 26$ lookup matrix built with NumPy. The code calculates the physical distance and spatial entropy for every possible two-letter combination exactly once at the start of the program. When the script reads the word list, it performs a fast matrix lookup instead of running complex math formulas repeatedly. This optimization allows Python to process the entire dictionary file in a few seconds.
For reproducibility, the full analysis notebook is available in this Google Colab file. It contains the same keyboard coordinates, lookup matrix construction, word filtering, entropy scoring, and plotting pipeline used for the results below.
ALPHABET = "ABCDEFGHIJKLMNOPQRSTUVWXYZ"
char_to_idx = {char: idx for idx, char in enumerate(ALPHABET)}

dist_matrix = np.zeros((26, 26))
for c1 in ALPHABET:
    for c2 in ALPHABET:
        i, j = char_to_idx[c1], char_to_idx[c2]
        x1, y1 = KEYBOARD[c1]
        x2, y2 = KEYBOARD[c2]
        dist_matrix[i, j] = np.sqrt((x2 - x1) ** 2 + (y2 - y1) ** 2)

weight_matrix = 1.0 / (1.0 + dist_matrix)
prob_matrix = weight_matrix / weight_matrix.sum(axis=1, keepdims=True)
entropy_lookup = -np.log2(prob_matrix)
The script groups all the words by their length, filters out non-alphabetic characters, and counts individual letter frequencies for specific word lengths.
Theoretical Limit
The theoretical limit is the absolute highest entropy score a single transition can achieve on this keyboard layout. In our model, this happens when a starting key points to its least likely target. Long physical distance drives this, but the row-normalized probability also matters because every starting key has its own local distribution of possible next jumps.
To find this exact number, we can look at every single pair in our precalculated matrix and find the maximum value.
Here is the simple Python code to find the absolute theoretical limit and the keys that cause it:
import numpy as np

# Define layout coordinates
KEYBOARD = {
    'Q': (0, 0), 'W': (1, 0), 'E': (2, 0), 'R': (3, 0), 'T': (4, 0), 'Y': (5, 0), 'U': (6, 0), 'I': (7, 0), 'O': (8, 0), 'P': (9, 0),
    'A': (0.5, 1), 'S': (1.5, 1), 'D': (2.5, 1), 'F': (3.5, 1), 'G': (4.5, 1), 'H': (5.5, 1), 'J': (6.5, 1), 'K': (7.5, 1), 'L': (8.5, 1),
    'Z': (1.25, 2), 'X': (2.25, 2), 'C': (3.25, 2), 'V': (4.25, 2), 'B': (5.25, 2), 'N': (6.25, 2), 'M': (7.25, 2)
}

ALPHABET = "ABCDEFGHIJKLMNOPQRSTUVWXYZ"
char_to_idx = {char: idx for idx, char in enumerate(ALPHABET)}

# Precompute the 26x26 distance matrix
dist_matrix = np.zeros((26, 26))
for c1 in ALPHABET:
    for c2 in ALPHABET:
        i, j = char_to_idx[c1], char_to_idx[c2]
        dist_matrix[i, j] = np.sqrt((KEYBOARD[c2][0] - KEYBOARD[c1][0])**2 + (KEYBOARD[c2][1] - KEYBOARD[c1][1])**2)

# Convert distances to probabilities and entropy
weight_matrix = 1.0 / (1.0 + dist_matrix)
prob_matrix = weight_matrix / weight_matrix.sum(axis=1, keepdims=True)
entropy_matrix = -np.log2(prob_matrix)

# Find the absolute maximum entropy value in the matrix
max_entropy = np.max(entropy_matrix)
max_idx = np.unravel_index(np.argmax(entropy_matrix), entropy_matrix.shape)

start_key = ALPHABET[max_idx[0]]
target_key = ALPHABET[max_idx[1]]

print(f"Theoretical Limit: {max_entropy:.4f} bits")
print(f"Achieved by jumping from {start_key} to {target_key}")
When you run this script, the output shows the exact ceiling for your model:
Theoretical Limit: 6.0961 bits
Achieved by jumping from S to P
The absolute maximum entropy a single transition can ever have is 6.0961 bits. This occurs when jumping from S on the middle-left side to P on the top-right edge. Because real words like JALAP (5.9653 bits) score so close to this 6.1 ceiling, it proves they are pushing the absolute physical boundaries of the QWERTY layout.
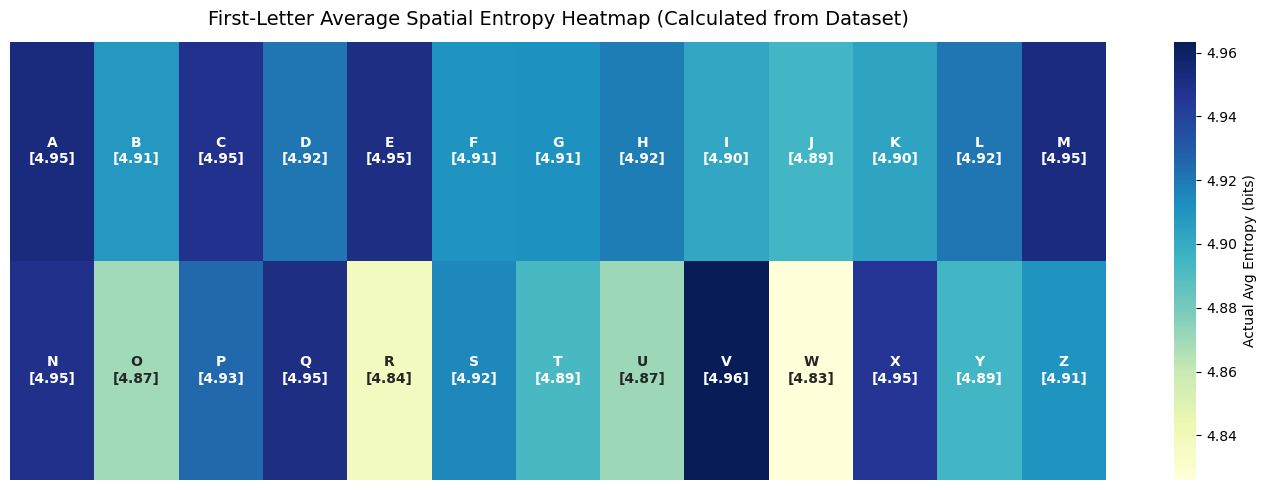
The 4.9-Bit Plateau
When you run the analysis across the entire dictionary, the output reveals a highly consistent pattern. The table below shows the total word count and the average spatial entropy per transition for word lengths from 5 to 15 letters.
| Word Length | Total Words | Avg Spatial Entropy (bits) |
|---|---|---|
| 5 | 15,921 | 4.9327 |
| 6 | 29,874 | 4.9122 |
| 7 | 41,998 | 4.9051 |
| 8 | 51,627 | 4.9042 |
| 9 | 53,402 | 4.9088 |
| 10 | 45,872 | 4.9116 |
| 11 | 37,539 | 4.9224 |
| 12 | 29,124 | 4.9267 |
| 13 | 20,944 | 4.9358 |
| 14 | 14,149 | 4.9333 |
| 15 | 8,846 | 4.9346 |
This data reveals that the average spatial entropy stays locked between 4.90 and 4.94 bits, regardless of word length. Because the scoring system divides the total entropy by the number of letter transitions, this uniformity tells us something steady about English text on a QWERTY layout. English vocabulary forces your hands to traverse a highly predictable, constant amount of physical distance per letter step.
There is a slight U-shaped curve in the numbers. The average spatial entropy dips to its lowest point around 7 to 8 letters and rises slightly at the outer edges.
- The Mid-Length Dip (7–8 Letters): These words form the core of everyday English vocabulary. They rely heavily on common prefixes, suffixes, and familiar letter combinations. Because these combinations occur frequently, the keyboard patterns smooth out into predictable, mid-range physical movements.
- The High-Length Rise (12–15 Letters): Very long words are often scientific or technical terms. They combine multiple Latin or Greek roots. This structural complexity introduces uncommon letter transitions, forcing your fingers into wider jumps across the board.
Before looking at the final list of winning words, ask yourself: what do you think the highest entropy words look like? You might expect long, complex words with rare letters like X, Q, or Z. The result is stranger than that. The winners are often short, almost rhythmic words that bounce between the far edges of the board.
The Maximum Entropy Champions
By tracking the individual words that scored the highest in each length category, the script found the exact items that maximize physical movement.
| Length | Max Entropy Word | Entropy Score (bits) |
|---|---|---|
| 5 | JALAP | 5.9653 |
| 6 | JALAPA | 5.9481 |
| 7 | AMALAKA | 5.8843 |
| 8 | PALAPALA | 5.9480 |
| 9 | PALAPALAI | 5.9201 |
| 10 | ENAMELWORK | 5.6926 |
| 11 | EPANALEPSIS | 5.7978 |
| 12 | SUSPENSORIAL | 5.6677 |
| 13 | CLEMCLEMALATS | 5.5979 |
| 14 | RABELAISIANISM | 5.5500 |
| 15 | PALEOALCHEMICAL | 5.5290 |
A clear physical pattern explains these winning words. For lengths 5 through 9, words like JALAP, AMALAKA, and PALAPALA score near the theoretical limit of 6 bits per transition. These words rely on letters like A, L, J, and P.
On the QWERTY coordinate grid, A sits at the far left of the middle row, while L sits at the far right of the middle row. Typing these words forces your fingers to bounce back and forth across the maximum width of the keyboard. In the Lazy Typist Model, these maximum-distance jumps are the least likely to occur, meaning they generate the highest amount of informational surprise.
As the words grow longer, the maximum entropy score drops from 5.96 bits down to 5.52 bits. A short word can consist entirely of rare, repeating letters that happen to sit on opposite edges of the layout. A 14 or 15-letter word must follow standard English rules to exist. Words like RABELAISIANISM contain large jumps, but they also require tightly clustered suffixes like “ISM” or “AL”. These close movements pull the overall average down, showing that language rules place a natural ceiling on physical randomness.
The Clustering Phenomenon
Because the words_alpha.txt file is organized alphabetically, we can analyze how these high-entropy words are distributed throughout the dictionary. We set a threshold for words with an exceptional spatial entropy score above 5.5 bits. The results show a distinct lack of randomness.
- Total words evaluated: 370,105
- Number of high-entropy words found: 3,917
- Average gap between high-entropy words: 94.48 lines
- Median gap between high-entropy words: 6.00 lines
- Minimum gap found: 1.00 line
The massive difference between the average gap of 94.48 lines and the median gap of 6.00 lines indicates a strong clustering effect. High-entropy words are not scattered evenly through the dictionary. Instead, they live in dense alphabetical pockets.
This clustering occurs because alphabetical sorting groups words with shared prefixes together. When the dictionary hits a specific root prefix that uses opposite sides of the keyboard, such as JALA- or PALAP-, multiple variations appear right next to each other. The physical layout of the keyboard and the alphabetical structure of the dictionary overlap to create specific zones of high finger movement.
Layout Showdowns and Path Geometry
We can see the impact of interface design by looking at alternative keyboard layouts. In the 1930s, the Dvorak layout was created to minimize finger movement by placing all vowels on the left side of the home row and the most common consonants on the right side.
If you type the word “DEATH” on a QWERTY keyboard, your fingers jump across different rows and columns, creating a high spatial entropy score. If you type “DEATH” on a Dvorak keyboard, those exact letters sit next to each other on the home row. The physical distance shrinks, and the spatial entropy score drops.
Tracing these movements also creates distinct visual paths on your keyboard grid, dividing words into structural styles:
- Ping-Pong Words: Words like “SKELETON” alternate constantly between the left and right hands, drawing wide zig-zag lines across the center axis. They represent maximum spatial entropy.
- Neighborhood Words: Words like “DEED” or “WAS” stay confined to a small corner of the board, drawing tight loops. They represent minimum spatial entropy.
The Layout Showdown: QWERTY vs. Dvorak vs. Colemak
To understand how alternative interface designs affect the physical structure of typing, we can run the exact same dictionary analysis on two major alternatives to the QWERTY layout: Dvorak and Colemak.
The Dvorak layout, engineered in the 1930s, focuses on comfort by placing all English vowels on the left side of the middle row and the most common consonants on the right side of the middle row. Colemak is a newer layout that modifies QWERTY to keep common letters on the middle row while preserving familiar keyboard shortcuts like Undo, Cut, Copy, and Paste.
When we process the 370,105 words from our dictionary file across all three systems, we get a clear look at how design changes alter spatial metrics.
| Length | QWERTY Entropy | Dvorak Entropy | Colemak Entropy |
|---|---|---|---|
| 5 | 4.9327 | 5.1764 | 5.0143 |
| 6 | 4.9122 | 5.1766 | 4.9994 |
| 7 | 4.9051 | 5.1701 | 4.9992 |
| 8 | 4.9042 | 5.1800 | 5.0085 |
| 9 | 4.9088 | 5.1868 | 5.0194 |
| 10 | 4.9116 | 5.1948 | 5.0233 |
| 11 | 4.9224 | 5.2023 | 5.0313 |
| 12 | 4.9267 | 5.2091 | 5.0290 |
| 13 | 4.9358 | 5.2154 | 5.0299 |
| 14 | 4.9333 | 5.2142 | 5.0236 |
| 15 | 4.9346 | 5.2141 | 5.0147 |
Note: A higher entropy score does not automatically mean a keyboard layout is worse. This metric measures spatial surprise between consecutive letters under the Lazy Typist Model. It does not directly measure comfort, speed, fatigue, or ergonomic efficiency.
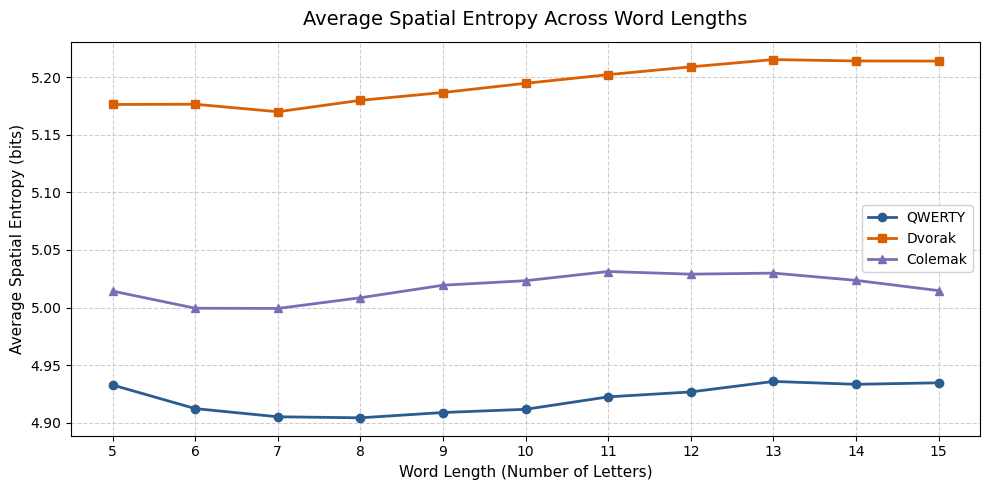
The Hand-Alternation Paradox
The data reveals a fascinating paradox. Dvorak was explicitly designed to minimize finger travel and maximize typing efficiency. Yet, across every single word length, Dvorak consistently scores the highest spatial entropy, stabilizing at a plateau of roughly 5.17 to 5.21 bits. QWERTY scores the lowest at roughly 4.90 to 4.94 bits, while Colemak sits directly in the middle at around 4.99 to 5.03 bits.
To understand why an efficiency-focused layout generates more spatial entropy, we have to look at the mechanics of how Dvorak achieves its speed.
Dvorak relies heavily on strict hand alternation. By isolating vowels to the left hand and common consonants to the right hand, the layout forces you to alternate hands for almost every syllable you type. Physically, this means your hands take turns pressing keys.
On our coordinate grid, jumping from a vowel on the far left of the board to a consonant on the right side requires crossing the entire horizontal axis of the keyboard. Because successive letters are consistently placed on opposite sides of the layout, the physical distance between consecutive keystrokes remains large. In our Lazy Typist Model, these cross-board jumps represent low-probability transitions for a single hand, which results in a higher overall measure of informational surprise and spatial entropy.
QWERTY, by contrast, frequently clumps common letter combinations onto the same hand or even adjacent keys on the same row. While this clumping caused mechanical typewriters to jam in the 19th century, it means your fingers often stay confined to small clusters. This clustering lowers the average physical distance per transition, resulting in lower spatial entropy scores across the dictionary.
Colemak balances these two philosophies. It optimizes letter placement on the middle row to reduce vertical row jumps, but it avoids the strict left-right side separation of Dvorak. As a result, its spatial entropy values land right between the two older layouts.
Model Limitations
This model is useful because it turns keyboard geometry into a measurable signal, but it is still a proxy. It does not know which finger presses each key, whether two letters use the same hand, how trained typists build muscle memory, or how real people pause, correct, and vary their rhythm. It also treats every possible next key as part of a geometry-based probability distribution, rather than learning probabilities from actual typing behavior. So the numbers should be read as spatial entropy under a specific model, not as a direct measurement of human effort.
Conclusion
The keyboard layout we use every day is not a neutral blank canvas. It is a physical map of historical engineering choices and linguistic patterns. By applying Shannon entropy to the physical coordinates of a keyboard, we can see that human language interacts with physical interfaces in highly stable, measurable ways.
Our everyday vocabulary maintains a steady 4.9-bit plateau of physical surprise on QWERTY, while changing the layout to a system like Dvorak shifts the entire language baseline to a higher entropy plateau. Whether your fingers are tracing small localized loops or bouncing rhythmically across opposite hands, every word you type is a direct mathematical expression of spatial probability.
Enjoy Reading This Article?
Here are some more articles you might like to read next:
Comments